
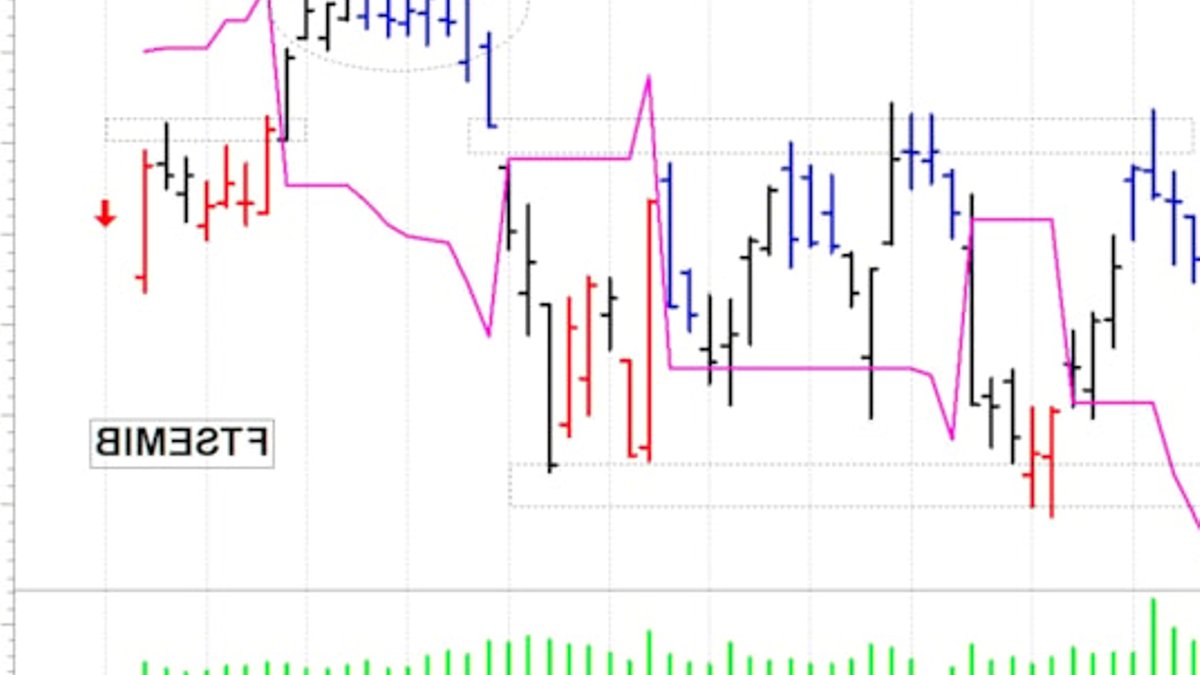
The Italian benchmark FTSE MIB closed the week below the 53,150‑point resistance, prompting a modest pullback that left traders watching for the next directional cue.
FTSE MIB stalls near key resistance
After several sessions of incremental gains, the index failed to breach the 53,150 level and slipped back, suggesting that the short‑term chart remains indecisive. Analysts note that a genuine upward trend will likely require a period of re‑accumulation before another climb can be justified.
Technical charts indicate that only a confirmed breakout past the 54,000 threshold, verified at the close of a trading day, would generate a fresh long signal. Until that level is respected, momentum appears muted.
Risk scenarios and next targets
On the downside, a dip below 52,150 could trigger a swift correction, with the first objective positioned in the 51,600‑51,550 band.
More severe pressure would be needed to break the static floor located between 51,250 and 51,000 points. Should that level give way, a trend reversal might follow, potentially steering the index toward lower territory.
Technical outlook for BTP futures
The BTP future expiring in September 2026 attempted a recovery, buoyed by a pronounced short‑term oversold condition. Despite that momentum, the price stayed under the 116.50‑point mark, leaving the technical picture fragile.
Related: Hermitage secret hidden in Forte dei Marmi garden
Only a decisive breakdown of the static support zone between 115.50 and 115.45 points would generate a new bearish directional signal. The first downside target linked to such a breach lies around 115.10‑115.05, with a secondary objective near 114.80.
Conversely, a sustained rally would still have to confront a solid resistance band in the 117.35‑117.50 range, implying that any upward thrust must clear that obstacle before a credible climb can be envisaged. As with the equity index, a period of re‑accumulation would be required to solidify any emerging bullish trend.
Euro/Dollar trends
The EUR/USD pair experienced a physiological correction that pulled the rate down to the 1.16 level. Despite this pullback, the short‑term technical environment remains constructive, with the primary directional indicators still positioned in a long stance.
A breakout above the 1.1715 threshold would be interpreted as a fresh strength signal, opening the way to an initial target zone of 1.1745‑1.1750 and a subsequent objective around 1.1780‑1.1785. Maintaining the support band between 1.1615 and 1.1600 is key for supporting a re‑accumulation phase that could underpin further upside.
Conversely, a move beneath the 1.15 level would be viewed negatively, potentially eroding the current constructive bias and prompting a reassessment of risk exposure.


Leave a Reply